
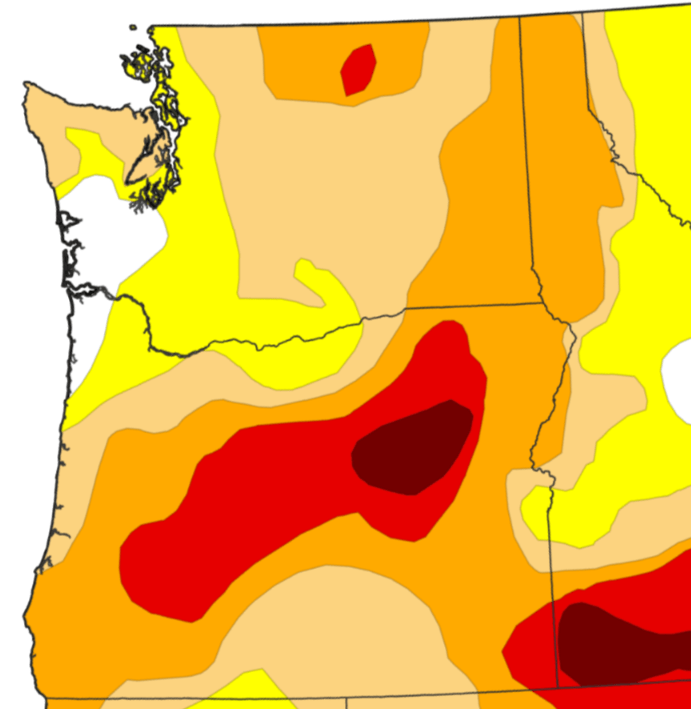
The colors on the U.S. Drought Monitor can make drought conditions appear uniform. If Pacific County and Spokane County are both classified as D2 Severe Drought—or D4 Exceptional Drought—it is easy to assume both places are experiencing the same temperature, humidity, soil moisture and wildfire danger.
They are not.
Conditions can even differ considerably within Pacific County. Ocean Park, located on the exposed Long Beach Peninsula near the Pacific Ocean, can experience different temperatures, humidity, fog, wind and rainfall than South Bend, which lies inland along the Willapa River and is influenced by surrounding hills and forests.
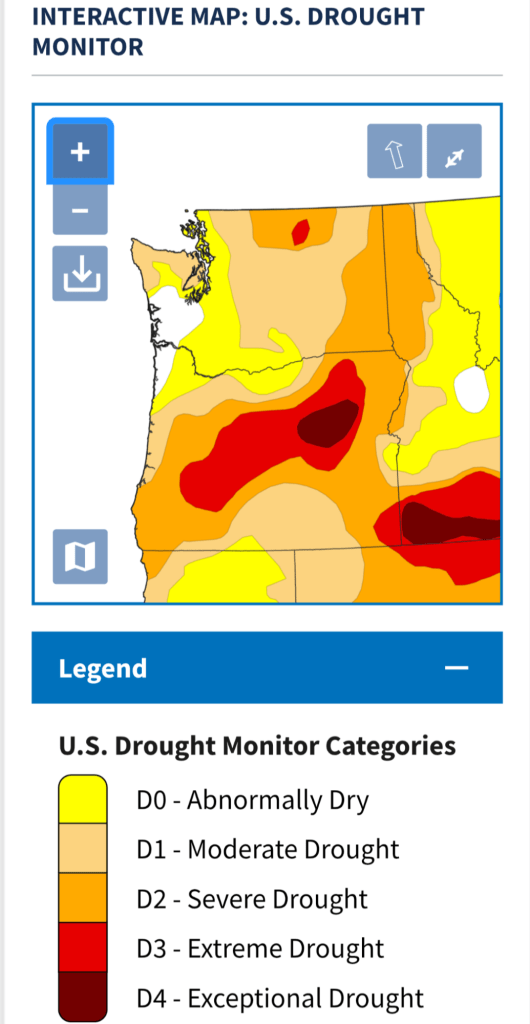
County-level drought information is useful for describing broad regional conditions, but it should not be interpreted as proof that every community or property within the county is experiencing identical conditions.
Drought categories measure historical rarity
According to NOAA, the U.S. Drought Monitor uses historical percentile rankings to classify drought:
- D0—Abnormally Dry: approximately the 21st-to-30th percentile
- D1—Moderate Drought: approximately the 11th-to-20th percentile
- D2—Severe Drought: approximately the 6th-to-10th percentile
- D3—Extreme Drought: approximately the 3rd-to-5th percentile
- D4—Exceptional Drought: approximately the 0-to-2nd percentile
A D2 designation means that drought indicators generally rank among approximately the driest 6% to 10% of conditions in the historical record for that location and time of year. D4 represents extraordinarily rare conditions within approximately the driest 2%.
These rankings measure how unusual conditions are compared with the location’s own climate. They do not represent a uniform amount of rainfall, soil moisture or fuel dryness nationwide.
D2 does not equal D2 everywhere
Suppose Pacific County and Spokane County are both designated D2. Both regions are experiencing unusually dry conditions compared with their respective historical records—but their actual environments can remain dramatically different.
Coastal Pacific County may still have:
- Cooler daytime temperatures
- Higher relative humidity
- Marine fog and low clouds
- More annual precipitation
- Wetter deeper soils
- More water in wetlands and drainage systems
- Slower drying of large trees and woody fuels
Spokane may simultaneously experience:
- Temperatures in the 80s or 90s
- Very low afternoon relative humidity
- Greater sunshine and evaporative demand
- Rapidly drying grasses and shrubs
- Lower fine-fuel moisture
- Greater potential for rapid fire spread
Both places can be D2 because each is unusually dry relative to what is normal there. However, their temperatures, humidity, fuel moisture and wildfire behavior may not be remotely equal.
The same principle applies to D4. Exceptional Drought in Pacific County and Exceptional Drought in Spokane indicate similarly rare departures from each region’s normal conditions—not identical physical conditions or consequences.
Ocean Park does not necessarily equal South Bend
The need for local interpretation does not stop at the county line.
Ocean Park and South Bend are both in Pacific County, but they occupy different geographic settings.
Ocean Park is located on the Long Beach Peninsula, close to the Pacific Ocean. Its weather is strongly influenced by the marine environment. Conditions commonly include cooler summer temperatures, coastal wind, fog, low clouds and relatively high humidity.
South Bend is farther inland, along the Willapa River and surrounded by forested terrain. It is less directly exposed to the immediate cooling effects of the Pacific Ocean. On a particular summer day, South Bend can be warmer, less foggy, less windy or subject to different rainfall patterns than Ocean Park.
These differences can influence:
- Daily maximum temperature
- Morning and afternoon humidity
- Fog and cloud cover
- Wind speed and direction
- Rainfall totals
- Evaporation rates
- Soil drying
- Vegetation stress
- Fine-fuel moisture
- Fire behavior
A drought map may place both communities in the same broad category, but that does not establish that their on-the-ground conditions are identical.
What county drought statistics actually mean
Drought information reported for Pacific County summarizes conditions across a broad geographic area. Pacific County includes the ocean shoreline, Long Beach Peninsula, Willapa Bay, river valleys, forests, hills and inland communities. Those landscapes do not respond uniformly to heat or reduced rainfall.
The detailed U.S. Drought Monitor is drawn using geographic boundaries that may cross county lines. County statistics commonly report the percentage of the county’s land area within each drought category. Therefore, Pacific County does not always receive one indivisible countywide rating.
However, when a map or table shows one category covering the entire county, that still does not mean every town, forest, wetland or property has the same:
- Rainfall deficit
- Temperature
- Humidity
- Soil moisture
- Groundwater level
- Vegetation condition
- Fuel moisture
- Wildfire danger
The map is a broad regional assessment. It is not a network of property-level weather and fuel measurements.
The Drought Monitor uses multiple indicators
The U.S. Drought Monitor does not rely on rainfall alone. Its authors use a “convergence of evidence” that can include:
- Short- and long-term precipitation
- Temperature
- Evaporative demand
- Soil moisture
- Streamflow
- Groundwater
- Reservoir and lake levels
- Snowpack
- Vegetation health
- Agricultural and ecological impacts
- Local observations and expert reports
Different indicators may point in different directions. Surface soils may dry quickly while deeper soils remain moist. Recent rain may improve grasses without restoring groundwater or streamflow. A coastal location may remain humid even during a substantial long-term precipitation deficit.
The final drought category represents an expert synthesis of this evidence. It does not mean that each indicator has independently reached the same level.
Drought is not a wildfire-danger rating
Drought can increase wildfire potential, but the U.S. Drought Monitor is not a real-time wildfire-danger map.
Actual fire danger also depends on:
- Current and forecast temperature
- Relative humidity
- Wind speed and direction
- Recent rainfall
- Fine-fuel and live-fuel moisture
- Vegetation type
- Fuel continuity
- Length of the dry period
- Topography
- Ignition probability
- Local fire history
- Energy Release Component
- Red Flag Warnings
- Availability of firefighting resources
A windy 90-degree afternoon with 15% relative humidity near Spokane can produce very different fire behavior than a 65-degree, humid and foggy afternoon in Ocean Park—even if both locations appear in the same drought category.
Likewise, South Bend could experience warmer or drier conditions than Ocean Park on a particular day even though both communities are represented by the same Pacific County drought statistic.
Implications for Firewise and tree regulations
A D2, D3 or D4 designation can support increased awareness and preparedness. It should not, by itself, be treated as proof that every community within the designated area faces the same wildfire threat.
Applying inland fire-risk assumptions automatically to coastal Ocean Park can confuse relative drought severity with actual local fire conditions. Applying a single countywide conclusion to both Ocean Park and South Bend can create a similar problem.
Before using a drought classification to justify tree removal, tree topping, vegetation restrictions or intensified Firewise enforcement, decision-makers should examine:
- Weather observations from stations near the affected community
- Local temperature and relative humidity
- Site-specific wind exposure
- Recent local rainfall
- Measured fuel moisture
- Vegetation and forest type
- Local fire occurrence and ignition history
- National Fire Danger Rating System measurements
- Current burn restrictions and fire-weather forecasts
- Conditions on the individual property
Tree topping or unnecessary canopy removal should not automatically be characterized as an appropriate drought response. Damaging or removing trees can reduce shade, raise ground temperatures, encourage dry grass and brush, increase wind penetration and create dead woody material. Those consequences should be included in any complete wildfire-risk evaluation.
The correct way to read a drought map
The U.S. Drought Monitor primarily answers:
How unusual and consequential is the moisture shortage compared with what is historically normal for this area?
It does not independently answer:
Does this location have the same temperature, humidity, vegetation dryness or wildfire danger as another place with the same drought category?
D2 in Pacific County does not necessarily equal the physical conditions associated with D2 in Spokane. D3 in Pacific County does not automatically equal D3 in Spokane. Even within Pacific County, conditions in Ocean Park may differ significantly from conditions in South Bend.
Drought maps are valuable regional tools, but their colors require local interpretation. Temperature, humidity, wind, rainfall, soil moisture, vegetation type and measured fuel conditions must be evaluated before drought categories are used to support community-specific wildfire policies or tree-enforcement decisions.
Sources:
NOAA — Drought Defined: A Deep Dive into the U.S. Drought Monitor
https://www.ncei.noaa.gov/news/drought-defined-deep-dive-us-drought-monitor
U.S. Drought Monitor — Drought Classification and Categories
https://droughtmonitor.unl.edu/About/AbouttheData/DroughtClassification.aspx
Drought.gov — Explaining Drought Category Maps
 Surfside Washington News