
SURFSIDE, Wash. The tropical Pacific is heating up as another round of rain heads toward the Long Beach Peninsula. NOAA expects a strong to very strong El Niño to persist into early 2027. That often tilts the Pacific Northwest toward a warmer winter, with drier conditions across much of the region. The Washington coast can still see intense rain and flooding in an El Niño winter, especially when storms arrive back to back.
NOAA’s October El Niño outlook — https://www.cpc.ncep.noaa.gov/products/analysis_monitoring/enso_disc_oct2026/ensodisc.shtml
U.S. Geological Survey outlook for the Northwest — https://www.usgs.gov/programs/climate-adaptation-science-centers/regional-super-el-nino-impacts-northwest-us
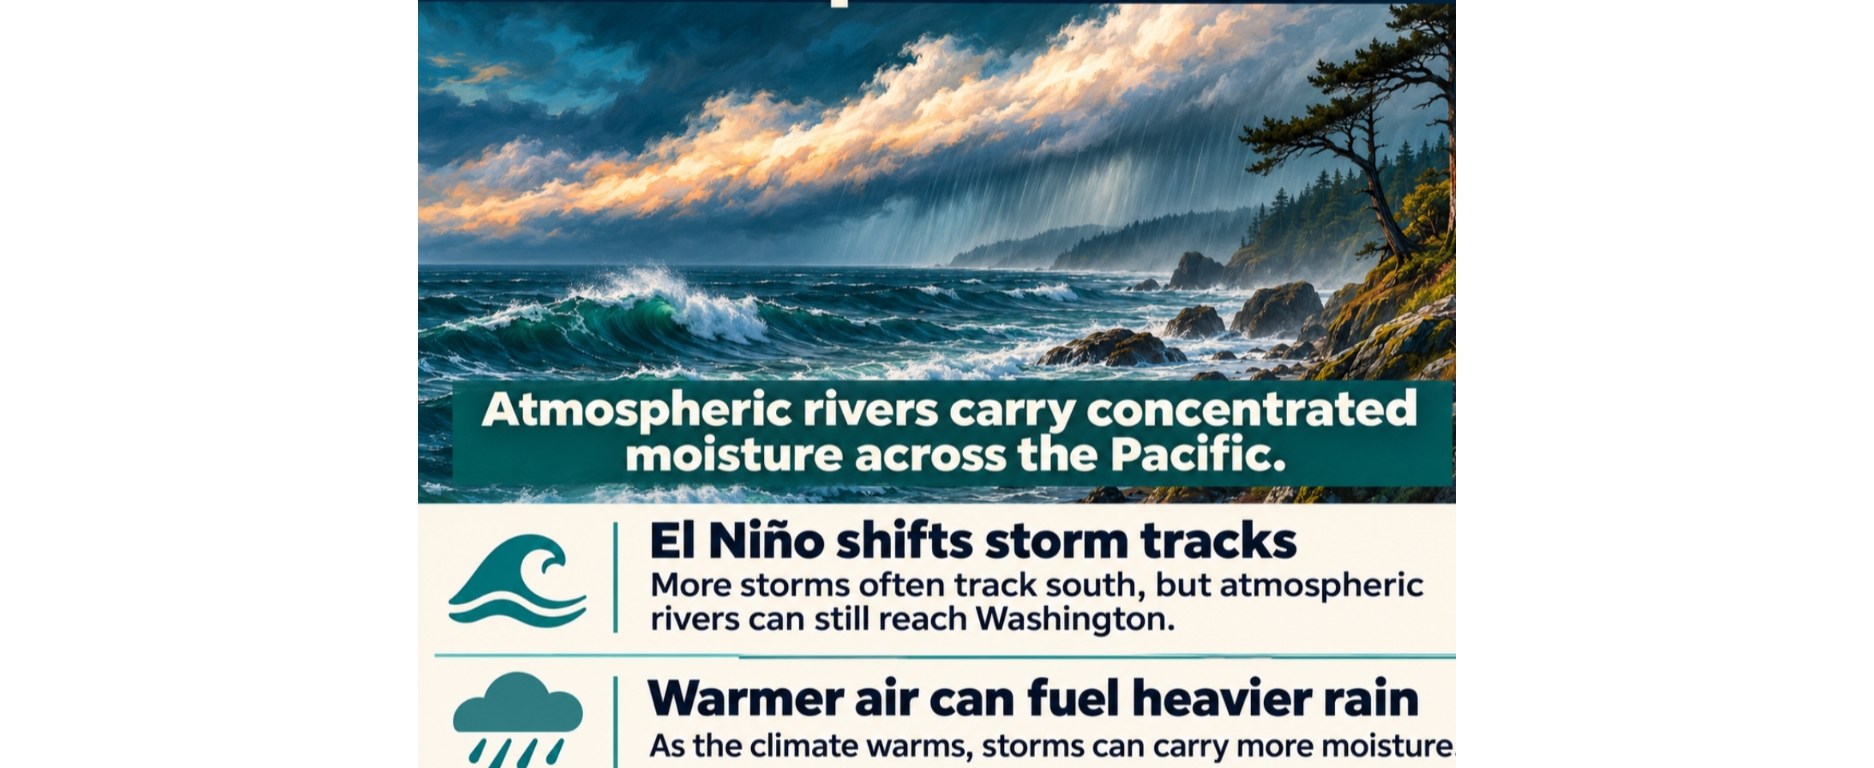
The bigger question for Surfside is how the Pacific will behave over the next several winters. El Niño can shift the paths storms take, and a warmer atmosphere can give those storms more moisture to work with. Scientists can estimate the odds for the coming season, while the timing of future El Niño and La Niña events and the storms that reach our coast remain much harder to predict.
NOAA’s seasonal probabilities — https://cpc.ncep.noaa.gov/products/analysis_monitoring/enso/roni/probabilities/
IPCC assessment of heavy precipitation — https://www.ipcc.ch/report/ar6/wg1/chapter/chapter-11/
What’s changing in the Pacific
El Niño is the warm phase of a recurring ocean and atmosphere cycle. As the usual east-to-west trade winds weaken, warm surface water spreads east along the equator. Tropical rainfall and thunderstorms shift east with it, changing the circulation far beyond the tropics. NOAA’s October report found that parts of the eastern equatorial Pacific were more than 4°C (7.2°F) above average. That was a reading for parts of the tropical Pacific. For January through March 2027, NOAA put the odds of a strong to very strong El Niño above 83 percent.
NOAA’s guide to El Niño — https://www.noaa.gov/understanding-el-nino
NOAA’s October diagnostic discussion — https://www.cpc.ncep.noaa.gov/products/analysis_monitoring/enso_disc_oct2026/ensodisc.shtml
During many El Niño winters, the Pacific jet stream steers more storms south of Washington. The coast has seen exceptions. During the strong 1997–98 El Niño, coastal Washington and Oregon received near- to above-normal precipitation. Much of the Northwest was also wetter than normal during the 2015–16 event, when a November atmospheric river brought heavy rain and flooding. The U.S. Geological Survey finds a weak relationship between El Niño and how much winter precipitation atmospheric rivers deliver to the Northwest. A few wet days can carry much of the season’s flood risk, even during an otherwise dry winter.
USGS Northwest El Niño assessment — https://www.usgs.gov/programs/climate-adaptation-science-centers/regional-super-el-nino-impacts-northwest-us
What forecasters expected for the week of Nov. 9
On Monday, Nov. 9, the National Weather Service in Portland forecast half an inch to an inch of rain for Pacific County on Tuesday, Nov. 10, with heavier rain over the Olympic Peninsula. It expected a drier Veterans Day, followed by another round of rain and breezy conditions late in the week. As soils get wetter, forecasters flagged the possibility of isolated flooding.
NWS Portland forecast discussion (updates as new forecasts are issued) — https://forecast.weather.gov/product.php?site=PQR&issuedby=PQR&product=AFD
An atmospheric river is a narrow band of air that carries large amounts of water vapor. The AR1-to-AR5 scale rates how strongly and how long that moisture flows at a given location. In its Nov. 6 outlook, the Center for Western Weather and Water Extremes counted Tuesday’s system as the fourth atmospheric river in the sequence. One model run showed peak conditions generally around AR3 along the regional coast. Timing and strength varied across the model runs.
Nov. 6 atmospheric river outlook — https://cw3e.ucsd.edu/cw3e-ar-outlook-6-november-2026/
Atmospheric river scale — https://cw3e-sio.ucsd.edu/arscale/
Why the next several winters are hard to predict
NOAA’s October outlook favors a return to neutral conditions by early summer 2027. Beyond the coming seasons, the order and strength of future El Niño and La Niña events are harder to pin down. Forecasts are especially tricky across the Northern Hemisphere spring, when models tend to lose skill at predicting which phase will develop. The North Pacific also has longer-lived shifts in sea-surface temperature, including a pattern called the Pacific Decadal Oscillation. The tropical cycle is one part of a basin that changes on several timescales.
NOAA’s seasonal probabilities — https://cpc.ncep.noaa.gov/products/analysis_monitoring/enso/roni/probabilities/
NOAA on spring forecast uncertainty — https://www.climate.gov/news-features/blogs/enso/why-making-el-nino-forecasts-spring-especially-anxiety-inducing
NOAA on the Pacific Decadal Oscillation — https://psl.noaa.gov/pdo/
Those shifts matter for where rain falls. A NOAA-led study found that winter atmospheric river activity across the western United States declined during the period it examined, from 1980 to 2020. The authors linked the trend to Pacific ocean and atmospheric circulation patterns that made it harder for atmospheric rivers to reach the West Coast. Over that period, where storms traveled helped shape what people on the ground experienced.
NOAA Geophysical Fluid Dynamics Laboratory — https://www.gfdl.noaa.gov/research_highlight/opposing-trends-in-winter-atmospheric-river-over-the-western-and-eastern-us-during-the-past-four-decades/
At the same time, the atmosphere’s capacity to hold water vapor rises about 7 percent for each 1°C (1.8°F) of warming. The Fifth National Climate Assessment projects more intense extreme precipitation in the Northwest. There is less agreement about the future strength of the El Niño ocean-temperature swings themselves. The IPCC finds that climate models disagree on how those swings will change over this century, even as several emissions scenarios point to larger rainfall swings associated with El Niño and La Niña later in the century.
IPCC on heavy precipitation — https://www.ipcc.ch/report/ar6/wg1/chapter/chapter-11/
Fifth National Climate Assessment, Northwest chapter — https://toolkit.climate.gov/sites/default/files/2025-07/NCA5_Ch27_Northwest.pdf
IPCC on future El Niño and La Niña variability — https://www.ipcc.ch/report/ar6/wg1/chapter/chapter-4/
What Pacific County learned last winter
From Dec. 2 to 18, 2025, successive atmospheric rivers, unusually high tides, and strong winds combined to flood parts of Pacific County and disrupt essential services. The state’s preliminary assessment counted 89 affected households in the county. Around Surfside’s canals and Seabreeze Lake, the sequence matters. Water can still be sitting in low spots when the next storm arrives, and a high tide can slow drainage through coastal outlets. Mature trees and vegetated ground can intercept some rain and slow runoff. Once soils are saturated, the condition and capacity of ditches, culverts, and outlets become especially important.
Washington’s December 2025 disaster assistance request — https://governor.wa.gov/sites/default/files/2026-01/WA_Individuatl%20Assistance%20Disaster%20Declaration%20Request-December%202025%20Winter%20Storm.pdf
EPA guide to trees and stormwater — https://www.epa.gov/sites/default/files/2016-11/documents/final_stormwater_trees_technical_memo_508.pdf
A seasonal outlook can tell us which way the odds lean. For decisions about travel or flooding on the peninsula, check the latest local forecast and county alerts. If water covers the road, turn around and take another route.
NWS Portland — https://www.weather.gov/portland/
Pacific County Emergency Management — https://pcema.info/
NWS flood safety — https://www.weather.gov/safety/flood-during

